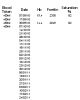
Simple spreasheet with that plots your progress on a graph as your hemoglobin (Hb), Ferritin and Saturation % progress over the course of your initial treatment of your hereditary hemochromatosis (it may be suitable for other conditions also)
Författare |
ironZulu |
Application |
Calc |
Kategori |
Personal: Private Documents |
License |
|
Etiketter |
Graph, chart, Ferritin. Saturation, Hb, hemoglobin, haemoglobin, venesection, phlebotomy. hereditary, hemochromatosis, haemochromatosis, C282Y, H63D |
Betyg |
(2 votes)
|
| Phlebotomy / Venesection Graph /Chart | |
Statistik |
Week: 0 - Månad: 0 - År: 0 - Timeline |
Graph of Ferritin & Hb levels during initial phlebotomy/venesection